The Non-Analytical Guide to Google Analytics for Car Dealers
I’m a car guy at heart, and it’s my 5-year old son who reminded me. We all love cars – that’s why we do what we do. Their lines, their smell, and the rush you get when you climb inside a car with more horses than you could fit on a football field. I love how old cars have so much character and meaning. As a tech nerd, I also love how new cars are beginning to push the boundaries of technology and connectivity. I’m an analytical guy and at the same time, I’m a feelings guy, so I choose my cars with fairly equal parts heart and head.
Like many of you, this is why I initially had so much trouble understanding VDP analytics – they were nothing but numbers!
As a leader in your dealership, you need to understand the significance of these numbers to make informed decisions about the performance of your website, and to evaluate your marketing spend. In brass tacks, you need to choose how you drive traffic to your website and your Vehicle Detail Pages based on numbers, instead of which vendor rep is more fun (I’m not saying you think that way… I’m just saying…).
I’ll let you in on a little secret: It starts making sense when you equate website numbers to numbers you would normally find on your dealership’s lot.
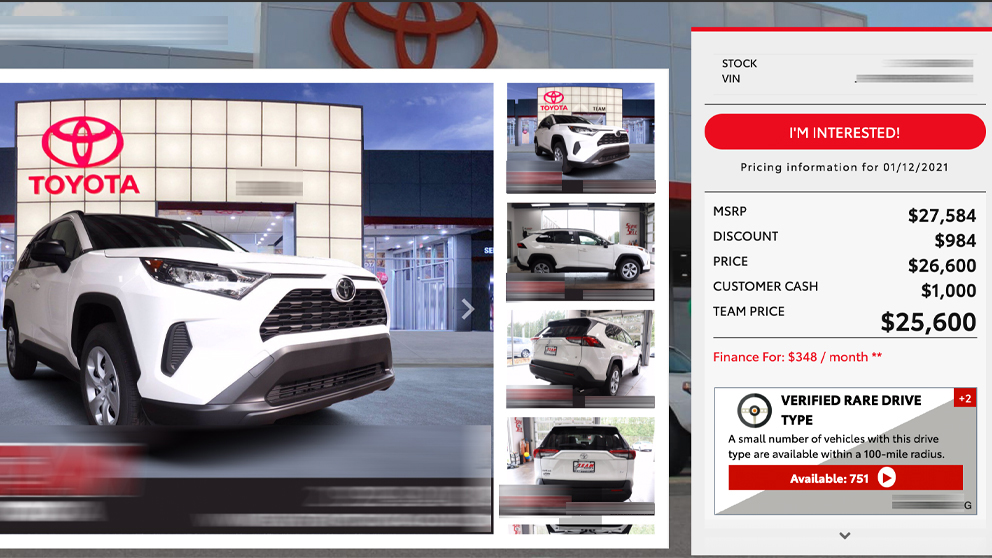
Think about it, a dealer’s website is the virtual representation of a brick and mortar lot. The unfiltered Search Results Page (SRP) is the representation of every car on your lot, and, if someone searches for all the SUV’s, that’s the equivalent to the big row of SUV’s at the back of your lot. The Vehicle Detail Page (VDP) is the representation of a specific car on your lot – like when a customer is effectively saying I like that Black XLT.
Once you start thinking about it this way, your dealership’s web analytics start making much more sense. Instead of focusing on the technical metrics themselves, focus on the numbers that you would otherwise ask your sales manager.
Here are some of the basic (less useful) metrics.
| Website Analytics | Real Life Dealership Equivalent | Why it’s not as Useful |
| Time on Site | The average amount of time someone spends on your lot. | There are many reasons why someone would come to your lot. Only one of which is to shop for cars. When you include time spent on all pages (instead of time spent only VDPs) you get a skewed result that raises more questions than answers. |
| Pages per session | The average amount of things a shopper interacts with on your lot, showroom and service center. | This metric is the easiest to get skewed as it counts everything. Imagine if you were counting the number of times a person was interacting with the coffee machine or your dealer group’s magazine. These numbers only tell you that the shopper is doing something and doesn’t accurately tell you if a shopper is interested in your cars. |
What are some of the “more” useful metrics?
| Website Analytics | Real Life Dealership Equivalent | Why it’s Useful |
| Time on VDP | The average amount of time someone spends on your lot looking at specific cars. | This gauges the level of interest people have in your cars. Typically the longer they look at a car, the more interested they are in it. |
| VDP per session | The average amount of cars a shopper looks at per visit. | This indicates the level of interest your market has in the cars on your lot. The more cars they look at per visit, the more likely buyers are going to find the cars they want to buy. |
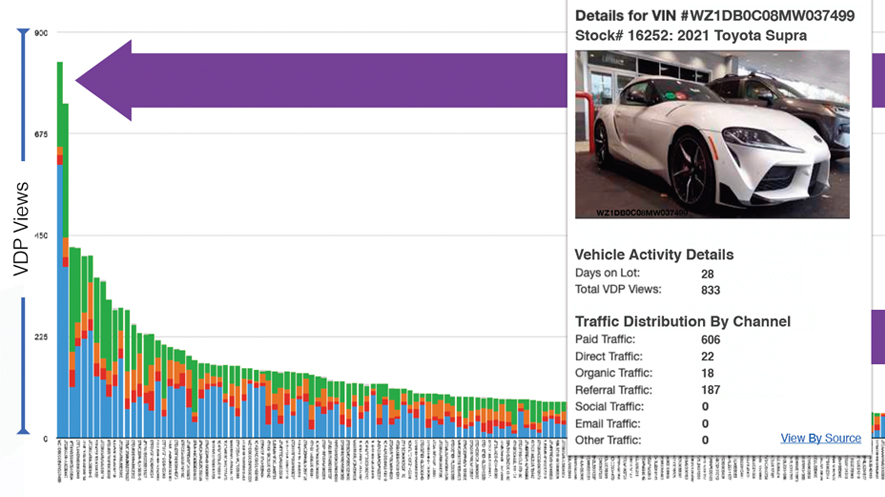
| Return VDP views | The average amount of visitors that come back to look at the same car. | This determines how many people are interested in a certain car. This metric refers to the amount of people that come back into your lot to look at your cars again.As with the behavior of someone looking to make a large purchase (a TV, a home, a car), the shoppers will typically visit the product page over and over again if they are interested in purchasing it.Likewise, the more return visits a VDP gets, the more likely someone is interested in that car. If you begin to see spiking traffic on specific cars, you’ll likely see that car leave the lot in the near future. |
See? It isn’t so bad once you translate these virtual metrics into plain English and think about them in terms of real life scenarios. With this method, you can make sense of all the technical mumbo jumbo, discuss VDP quality in a language that’s easy to understand and make the right decisions surrounding the performance of your website.