The Three Definitive Metrics That Determine Quality Dealership Website Traffic
All digital advertising channels will bring your dealership web traffic. But as a dealer, that’s not what you want. What you want is an advertising channel to bring you online car shoppers that are interested in the cars that you have on your lot. This, in turn, will increase your chances of online shoppers turning into showroom visitors, which will inevitably increase your sales.
So how can you tell if the traffic you’re driving is of high quality? In other words, how can you tell that the shoppers you’re attracting are interested in the cars that you have on your lot?
As a marketing professional in my own right, quality traffic is exactly what I, and all marketing professionals, look for.
However, through my interviews with many of our clients and countless other digital marketers, I have found an interesting trend: outside of lead form submissions (a tactic that is known to be reducing in frequency and thus reducing in impact), few have a concrete definition of what quality traffic is.
What I have found in other sectors of retail is that quality digital marketing is correlated to increased showroom foot traffic, and increased foot traffic is one indicator of future sales.
These are the metrics that should be looked at when assessing quality:
Time on VDP
What is it?
The average amount of time a person is specifically viewing individual cars online.
Why it’s important
A person’s time on a VDP is equivalent to the amount of time a person on your lot is sitting and looking at individual cars. The longer they are looking, the more they are interested in the cars you have. A high Time on VDP metric means the traffic driven from that source is interested in the inventory you have on the lot.
How to calculate it
Calculating Time on VDP is similar to calculating time on site but only counting VDP pages instead of all pages. This can be done by segmenting your pages and then calculating Time on VDP.
Interpretation
The longer the average duration the better. A higher Time-on-VDP indicates that the person is engaged in the cars you have, while a low Time-on-VDP indicates that shoppers are simply browsing with little intent and moving on.
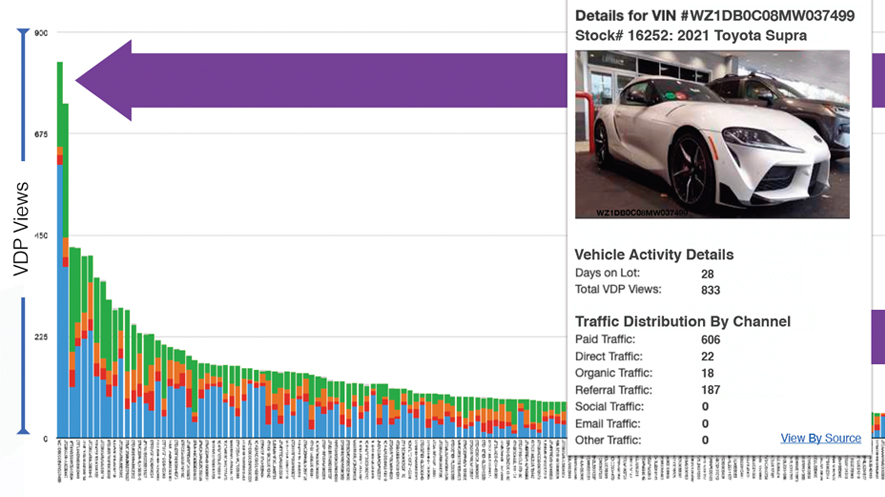
VDPs Per Session
What is it?
The average amount of vehicle detail pages a person views per visit.
Why it’s important
In the real world, this metric would translate to how many cars a shopper looked at when they came on your lot.
How to Calculate it
For each traffic source in a given time frame calculate: VDP per Session = Total number of VDP views/Total number of sessions.
Interpretation
The higher the better. A higher VDP per Session indicates that this person is perusing through your inventory and finding cars they are interested in as opposed to a low VDP per Session amount which would indicate they did not find many cars to their liking. Typically, advertising channels range from 0.25 to 1.00 VDPs per Sessions as many traffic sources often drive shoppers that never peruse a vehicle of interest (aka that never view a VDP). An average VDP per Session of one or more is considered very performant – it indicates that all shoppers driven to your website are interested in at least one car on your lot.
Significant Actions per Session
What is it?
The average amount of VDP engagement actions a person takes when they visit your site.
Why it’s important
Significant actions are one of the best measurements for engagement. These can include engaging with the photo carousel, clicking on a “Get an e-Price” or “Trade-In” button or filling out a lead form.
How to Calculate it
For each traffic source in a given time frame calculate: Significant Actions/Session = Total number of Significant Actions/Total number of sessions.
Interpretation
While VDP Significant Actions per Session is a great metric to measure engagement, it’s customizability means that there is no standardization. What one dealer feels is significant, another may not. This makes it very difficult to benchmark from one dealership to another. Additionally, different advertising mediums have different significant action rates.
Yes, there are other metrics available to be measured (like bounce rate, which should be somewhere between 40 & 60 percent – beware if it jumps higher), however their value and impact at correlating showroom visitors is relatively limited when compared to the aforementioned metrics and therefore don’t have as much impact.
With these four key metrics in mind you can be confident that you can assess what is quality website traffic.